 32 frames
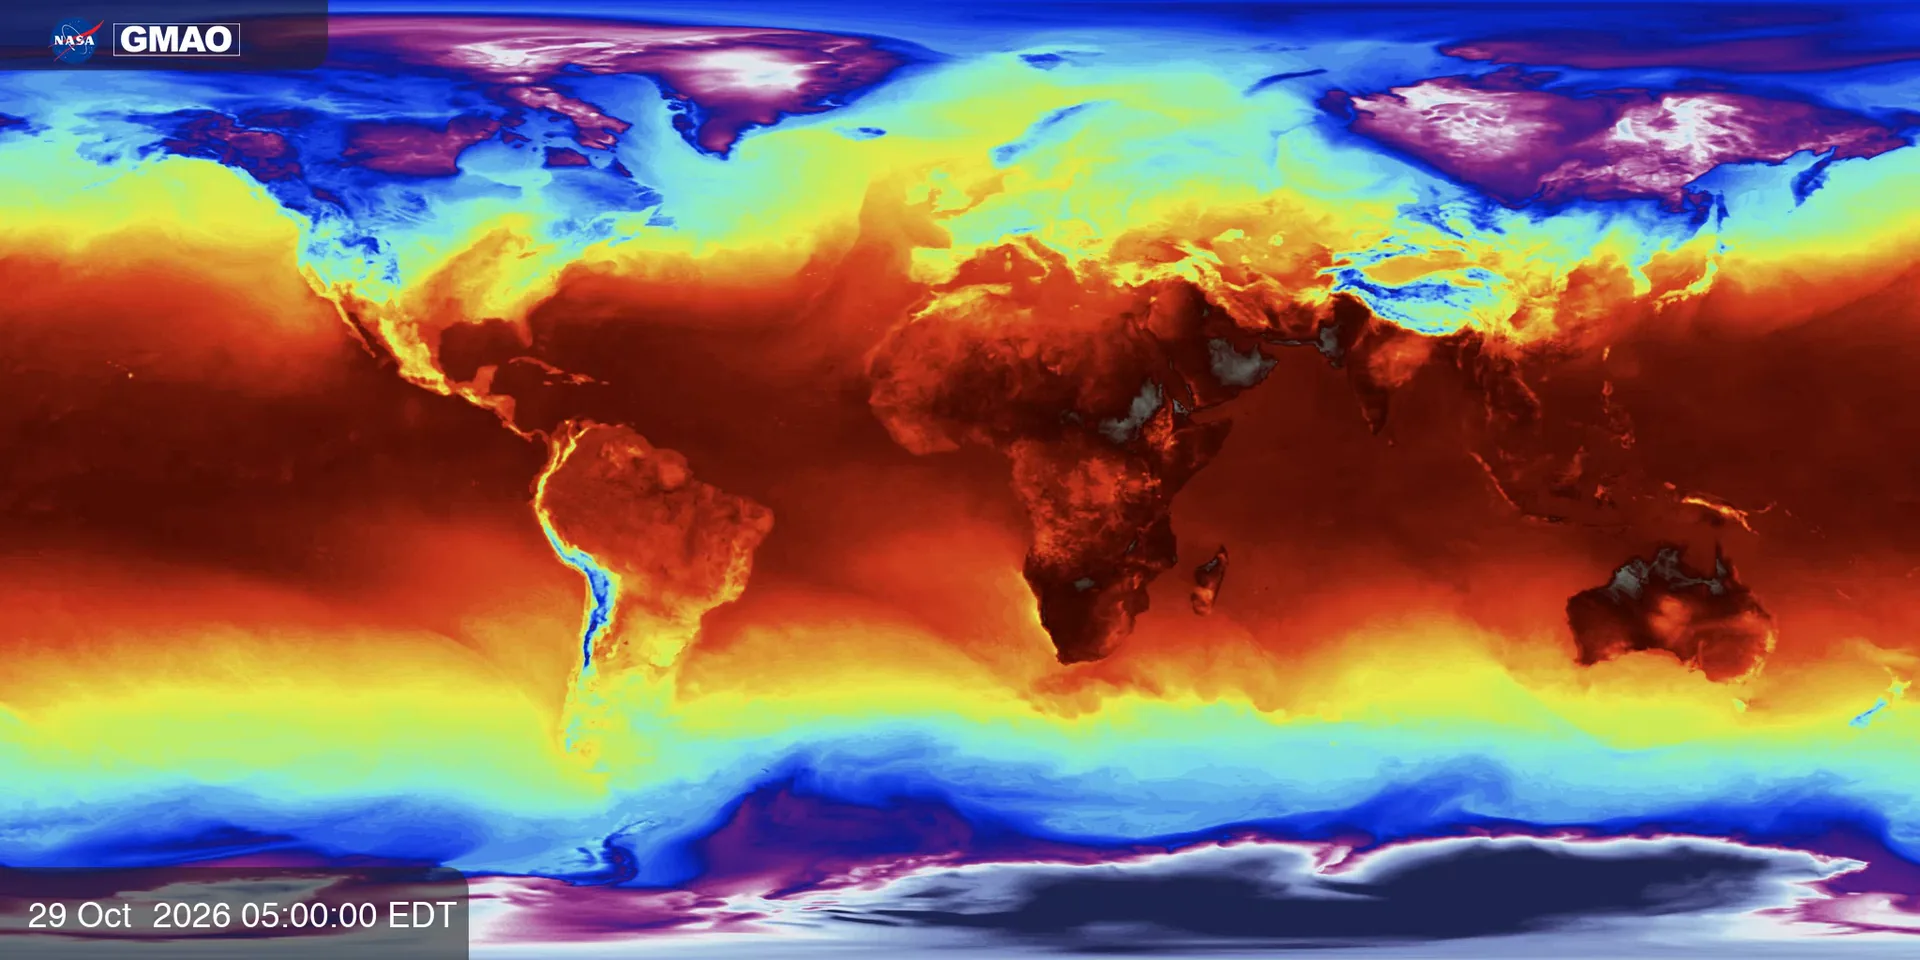
Near-surface air temperature
Air temperature close to the ground, all over the world.
- Period
- Oct 29 – Nov 13, 2026
- Scale
- −40 to 40 °C
Approximate reading
Sources
Every sound in Earth Jukebox starts as a NASA visualization. These are the datasets we listen to, where they come from, and the references we used to read their colors.
Our engine reads the color of every pixel and turns it into a number using the visualization’s color scale. Not every scale is equally precise, so each dataset is labeled with how its values should be read.
Values come from the official NASA color scale, in physical units.
The scale was rebuilt from the published color bar, so values are indicative.
No scale is published: a 0–1 index that means “more” or “less”, never a unit.
NASA Scientific Visualization Studio · GEOS model (GMAO)
Two weeks of the planet’s weather and air in autumn 2026. GEOS-FP blends millions of weather observations with a forecast model; GEOS-CF estimates what is in the air. These are model estimates, not satellite photos.
32 framesAir temperature close to the ground, all over the world.
 32 frames
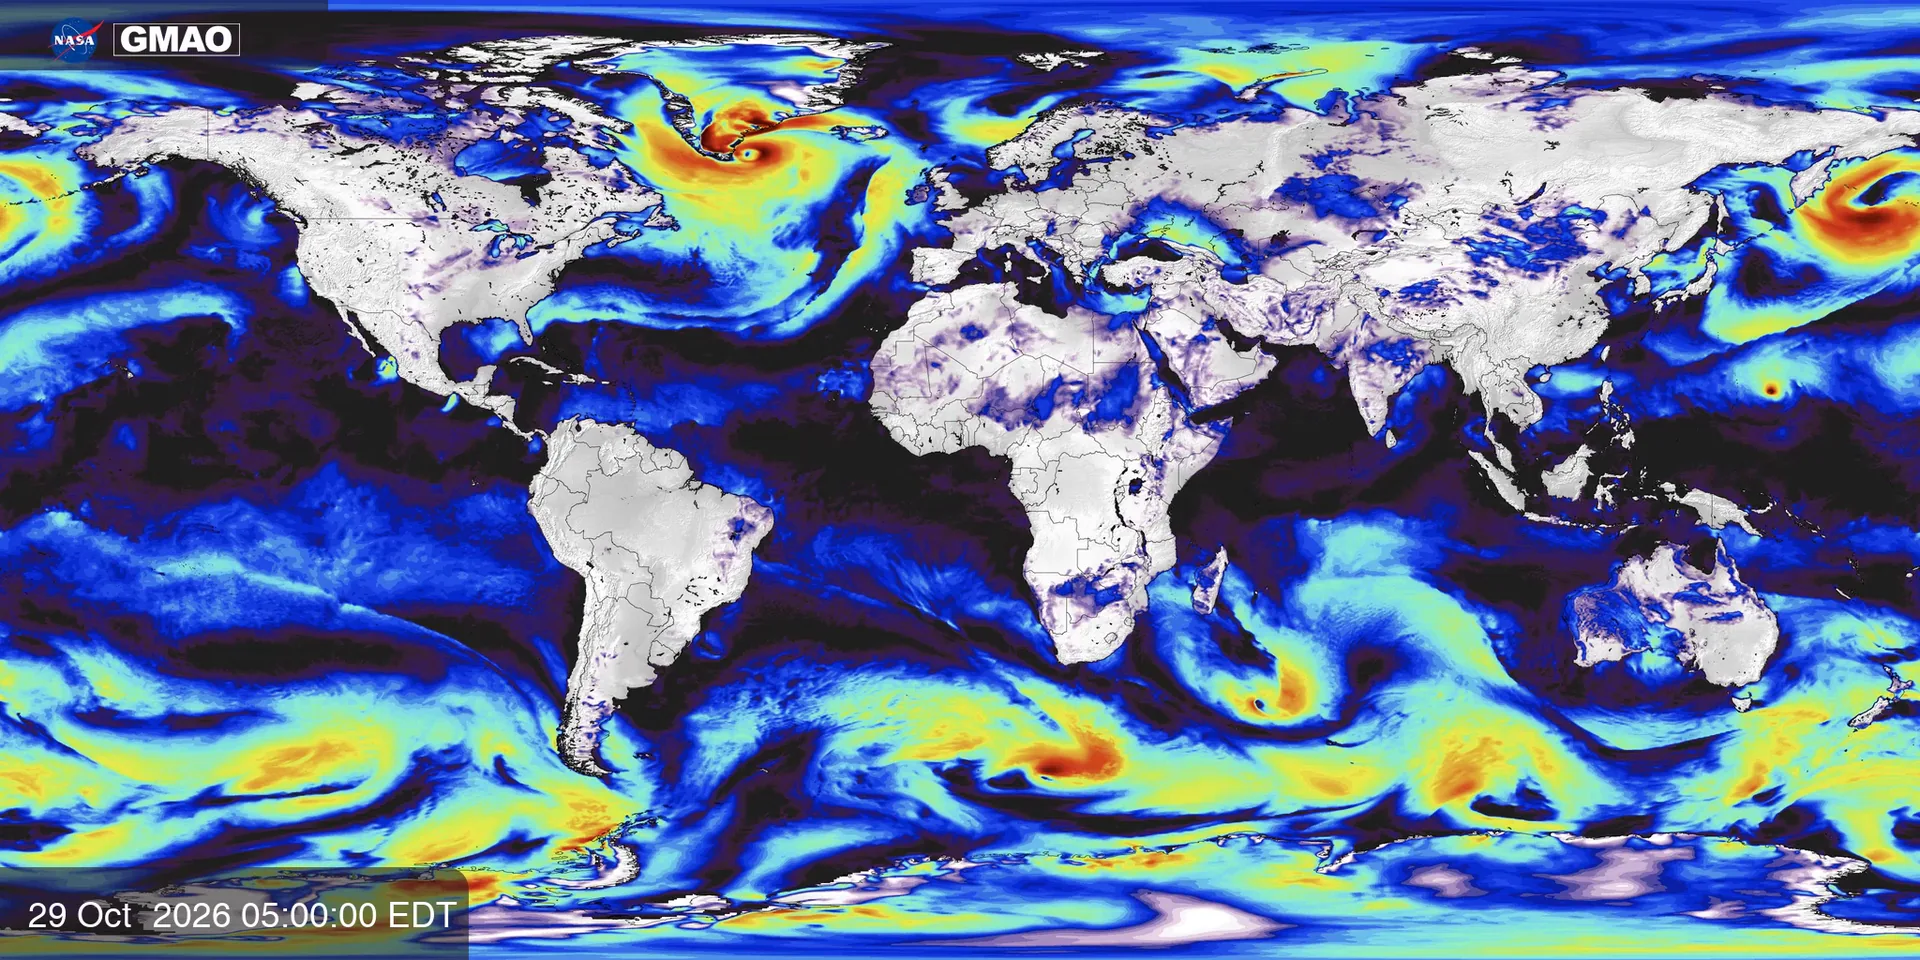
Wind speed 10 meters above the surface; calm areas are not drawn.
 32 frames
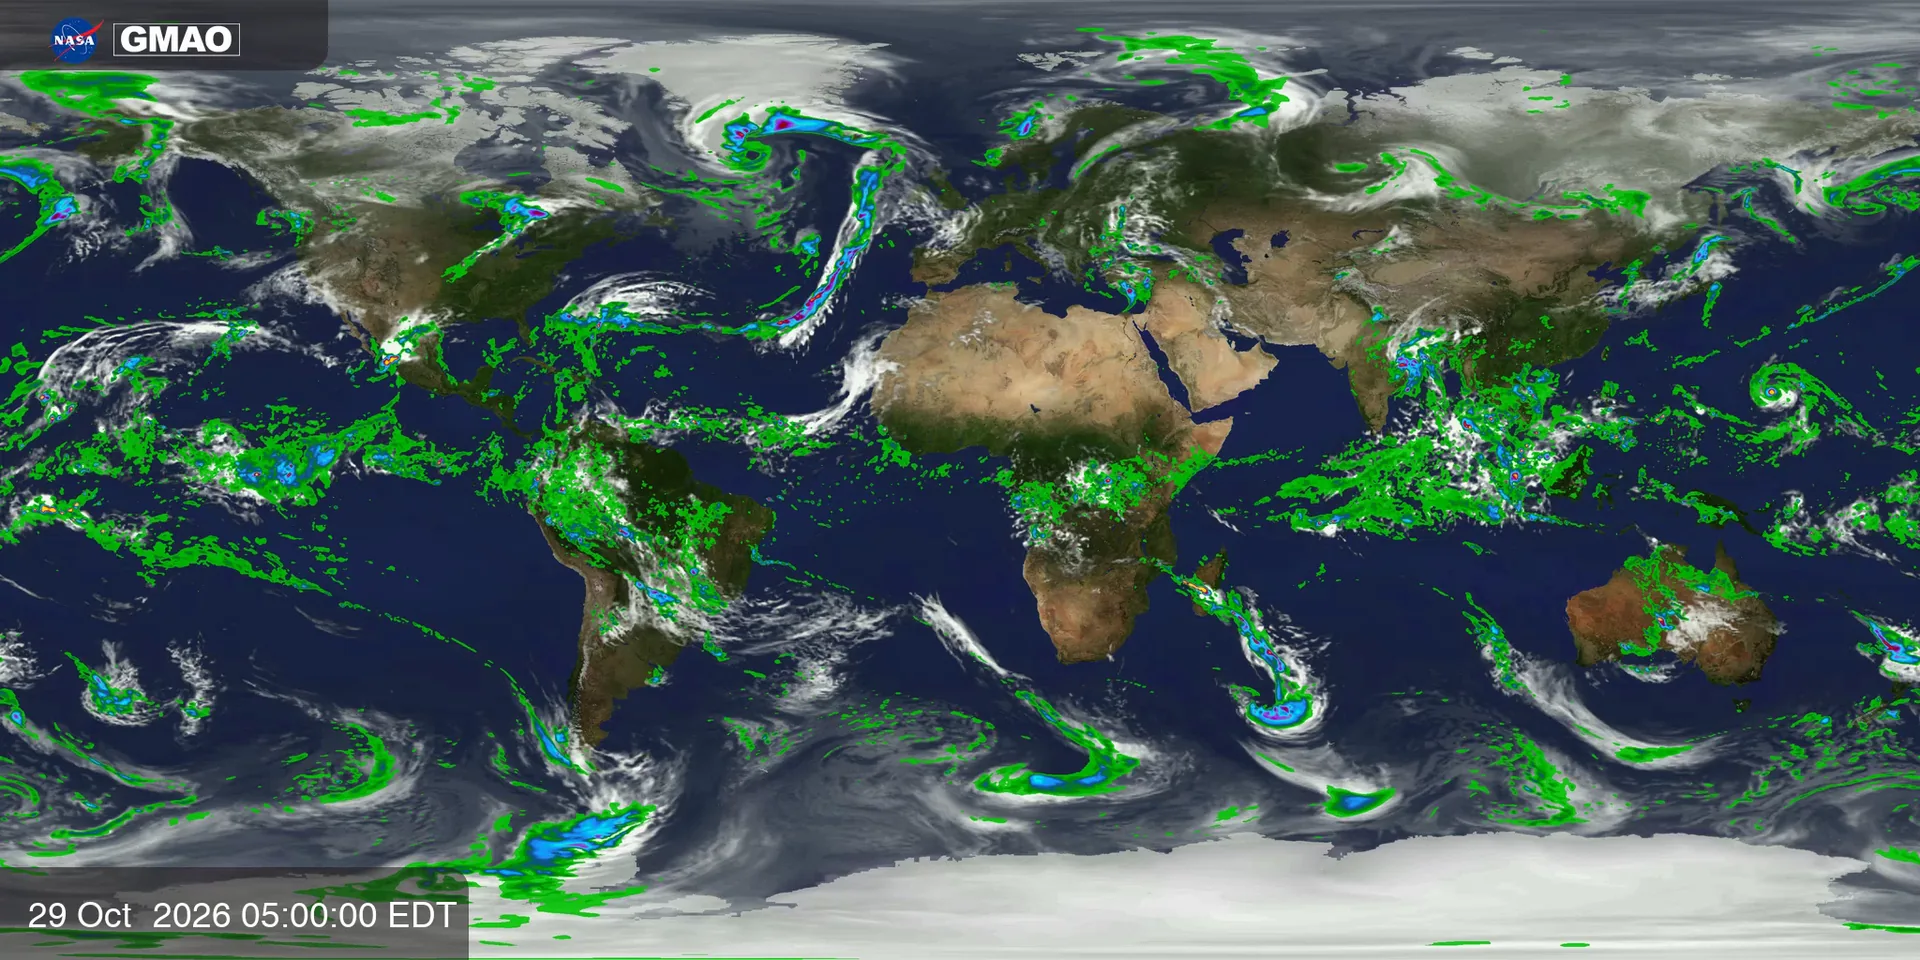
Estimated rain, drawn over the clouds and the land.
 32 frames
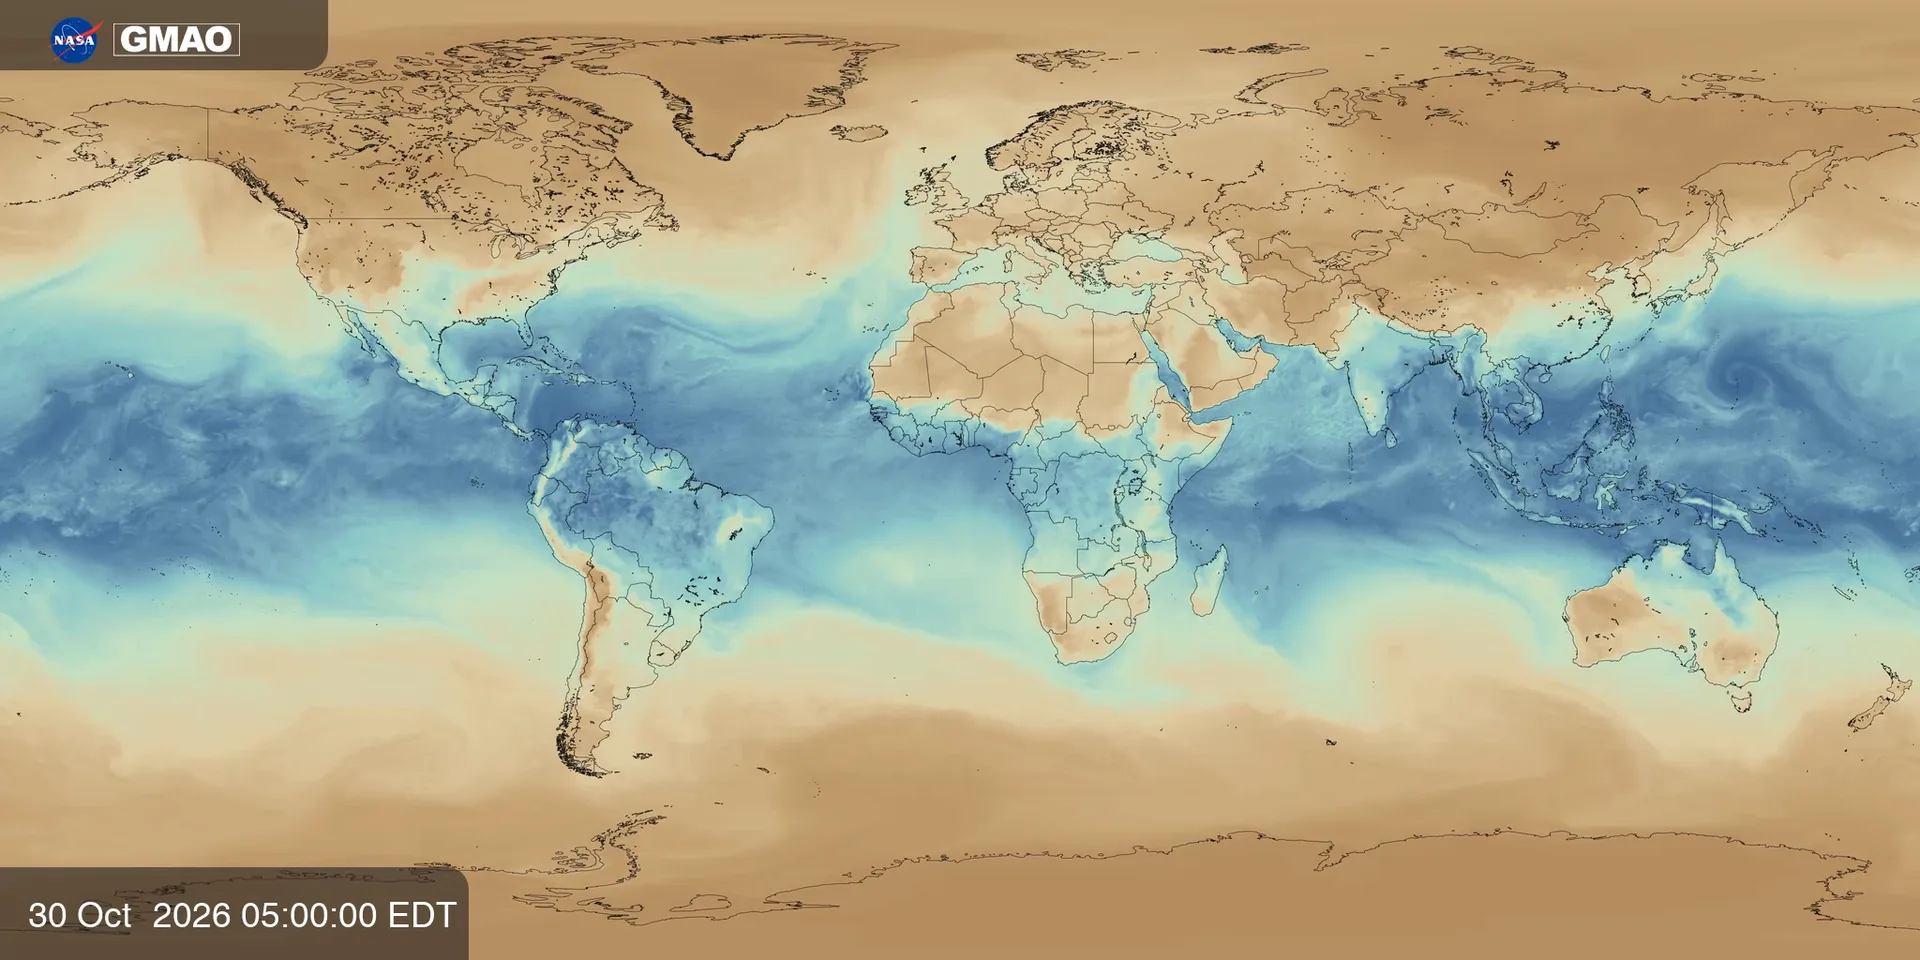
Grams of water vapor in each kilogram of air near the surface.
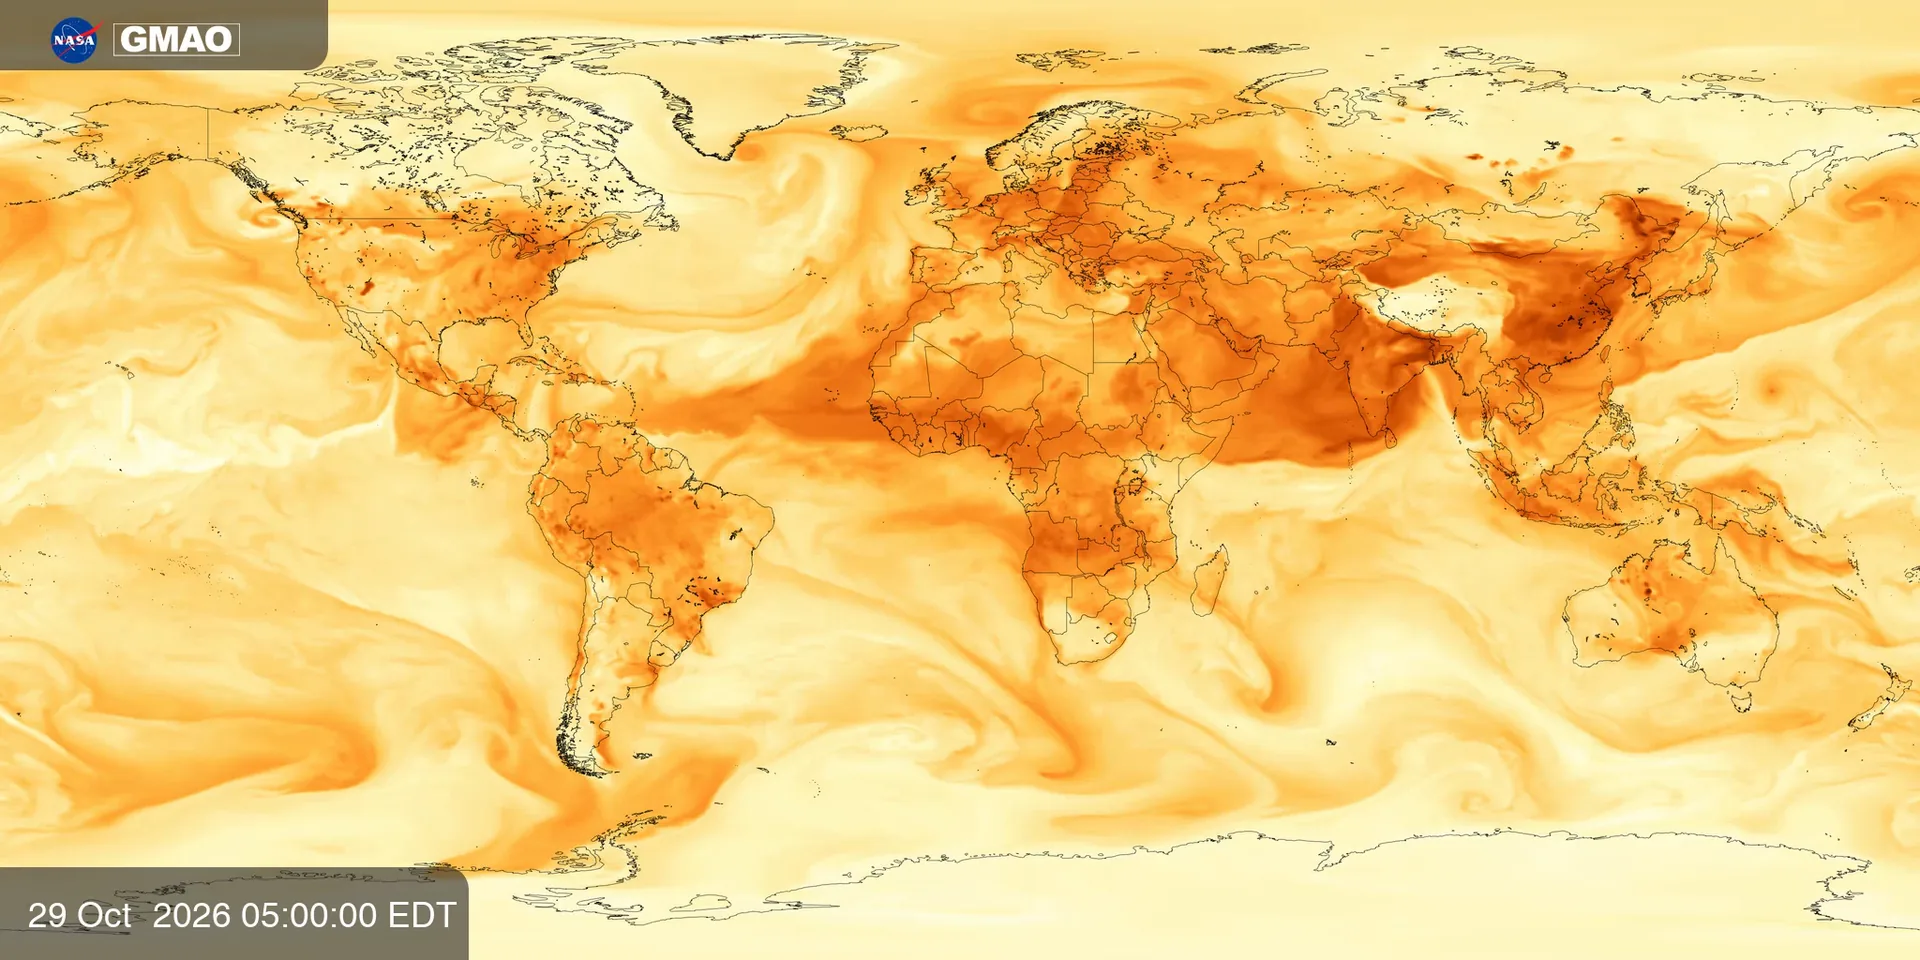 32 frames
Dust, smoke and pollution small enough to breathe in.
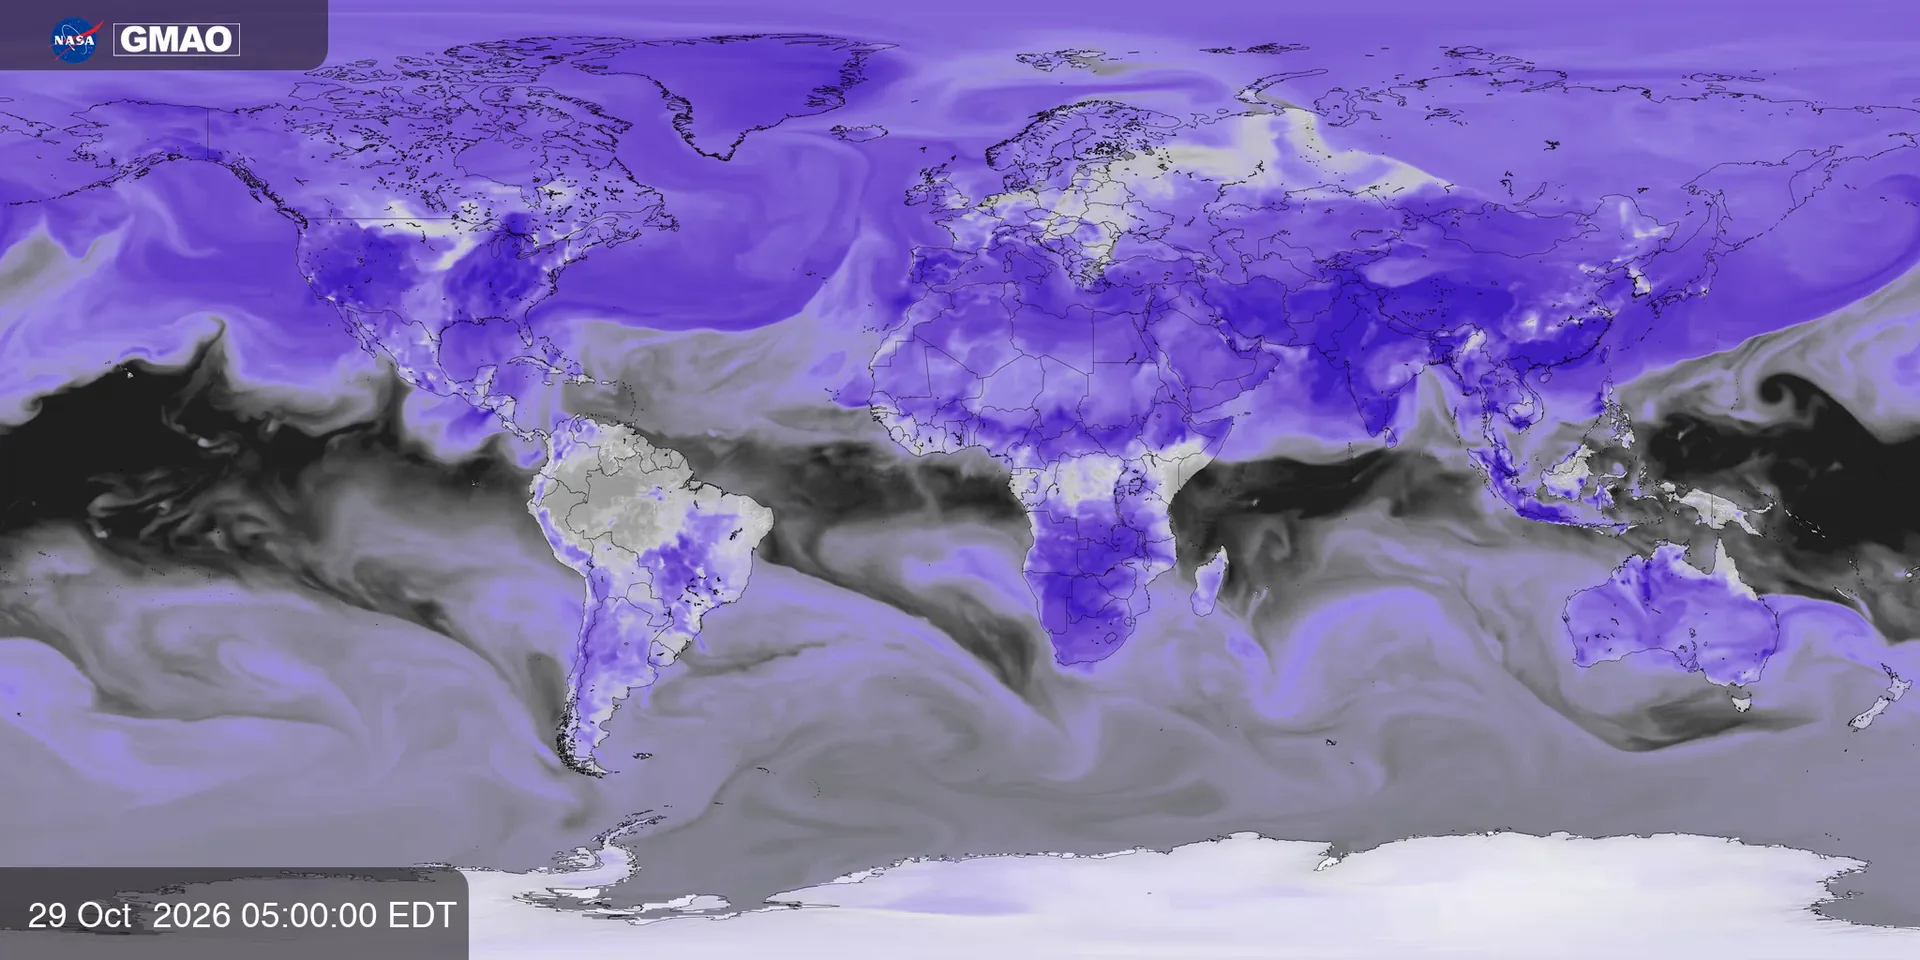 32 frames
Ozone near the surface, a pollutant — not the ozone layer.
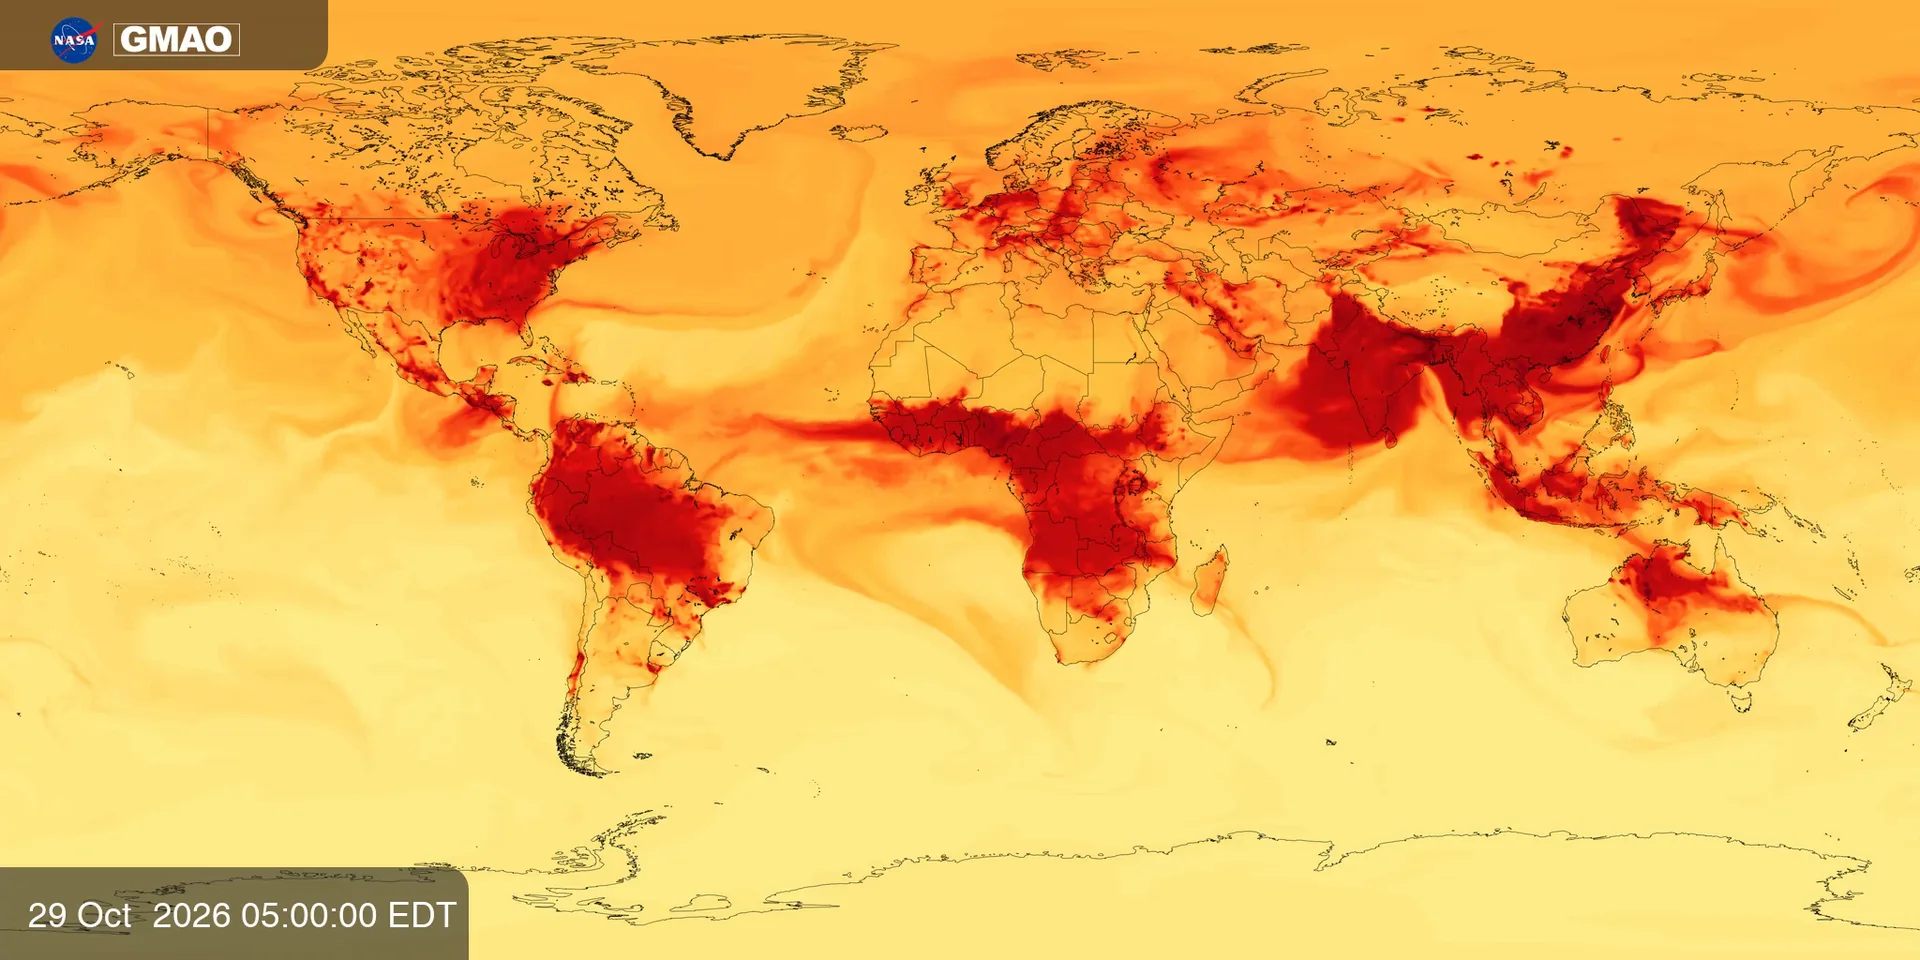 32 frames
A gas that comes mostly from burning: fires, traffic and industry.
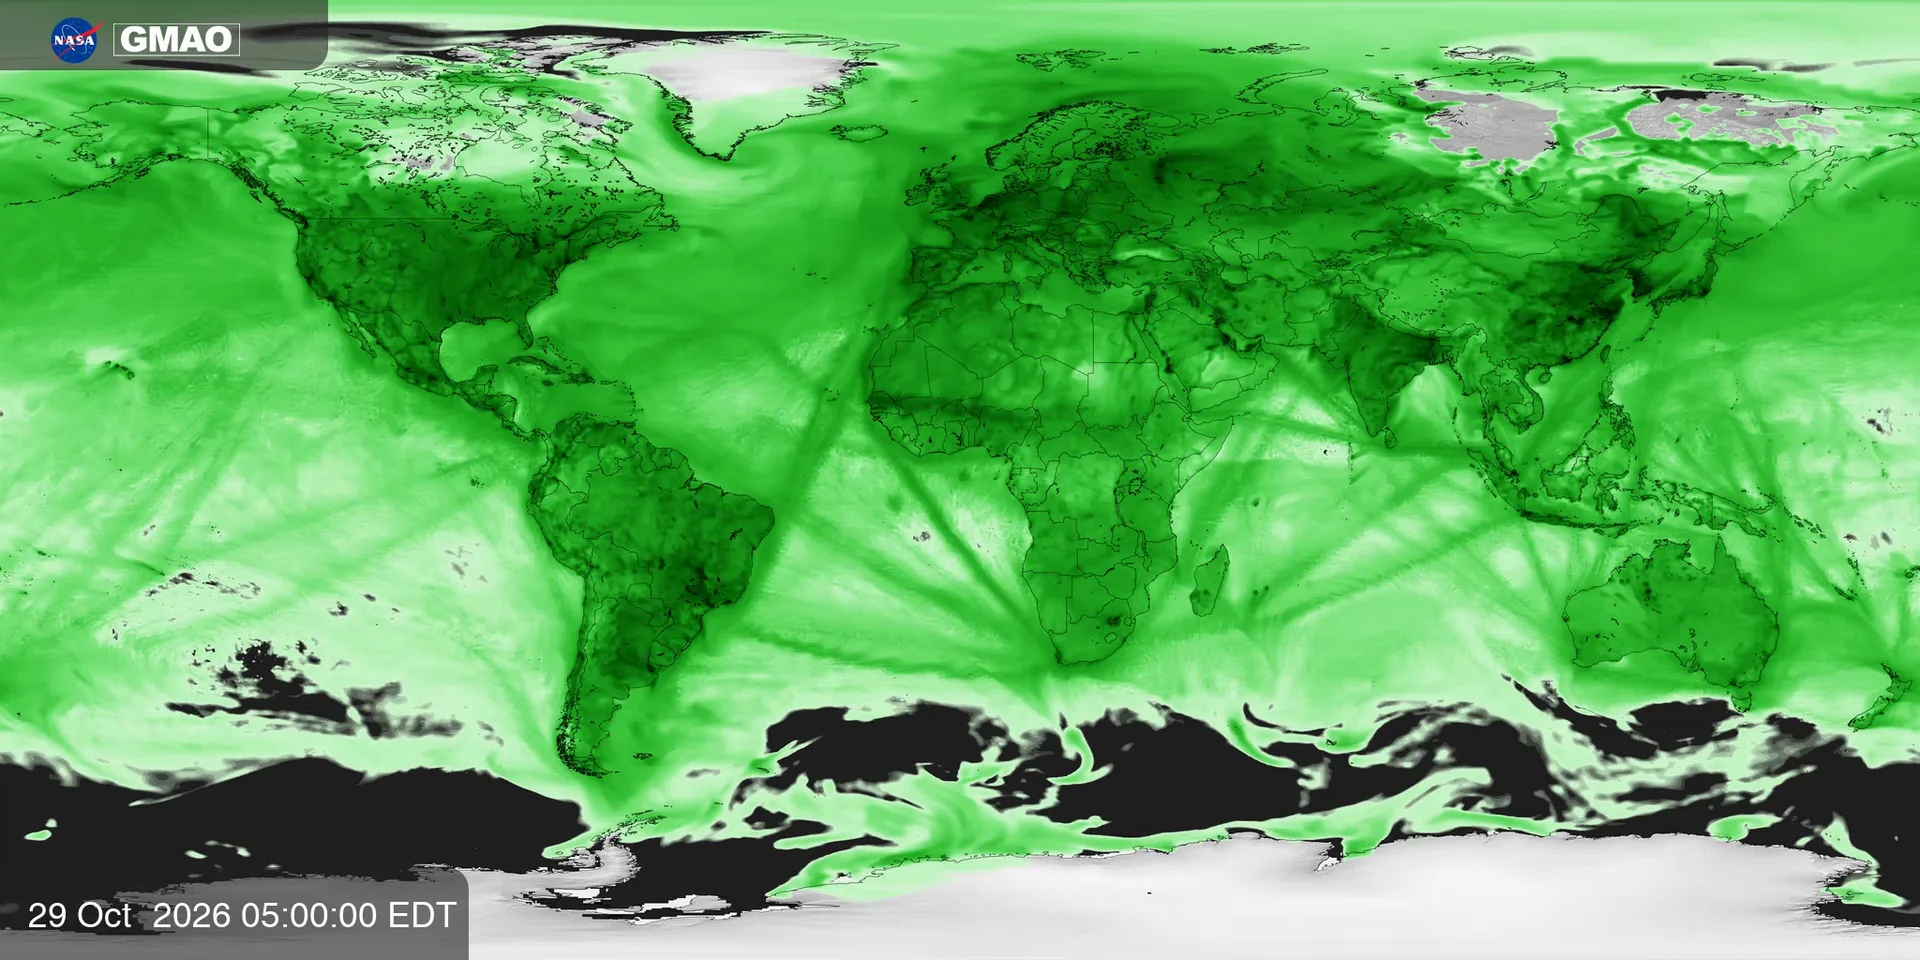 32 frames
NO and NO₂ near the surface, typical of traffic and industry.
NASA Scientific Visualization Studio
Ocean currents, a year of carbon dioxide and seven years of lightning. On the globes there are no countries to measure: “north” and “south” mean the top and bottom of the image.
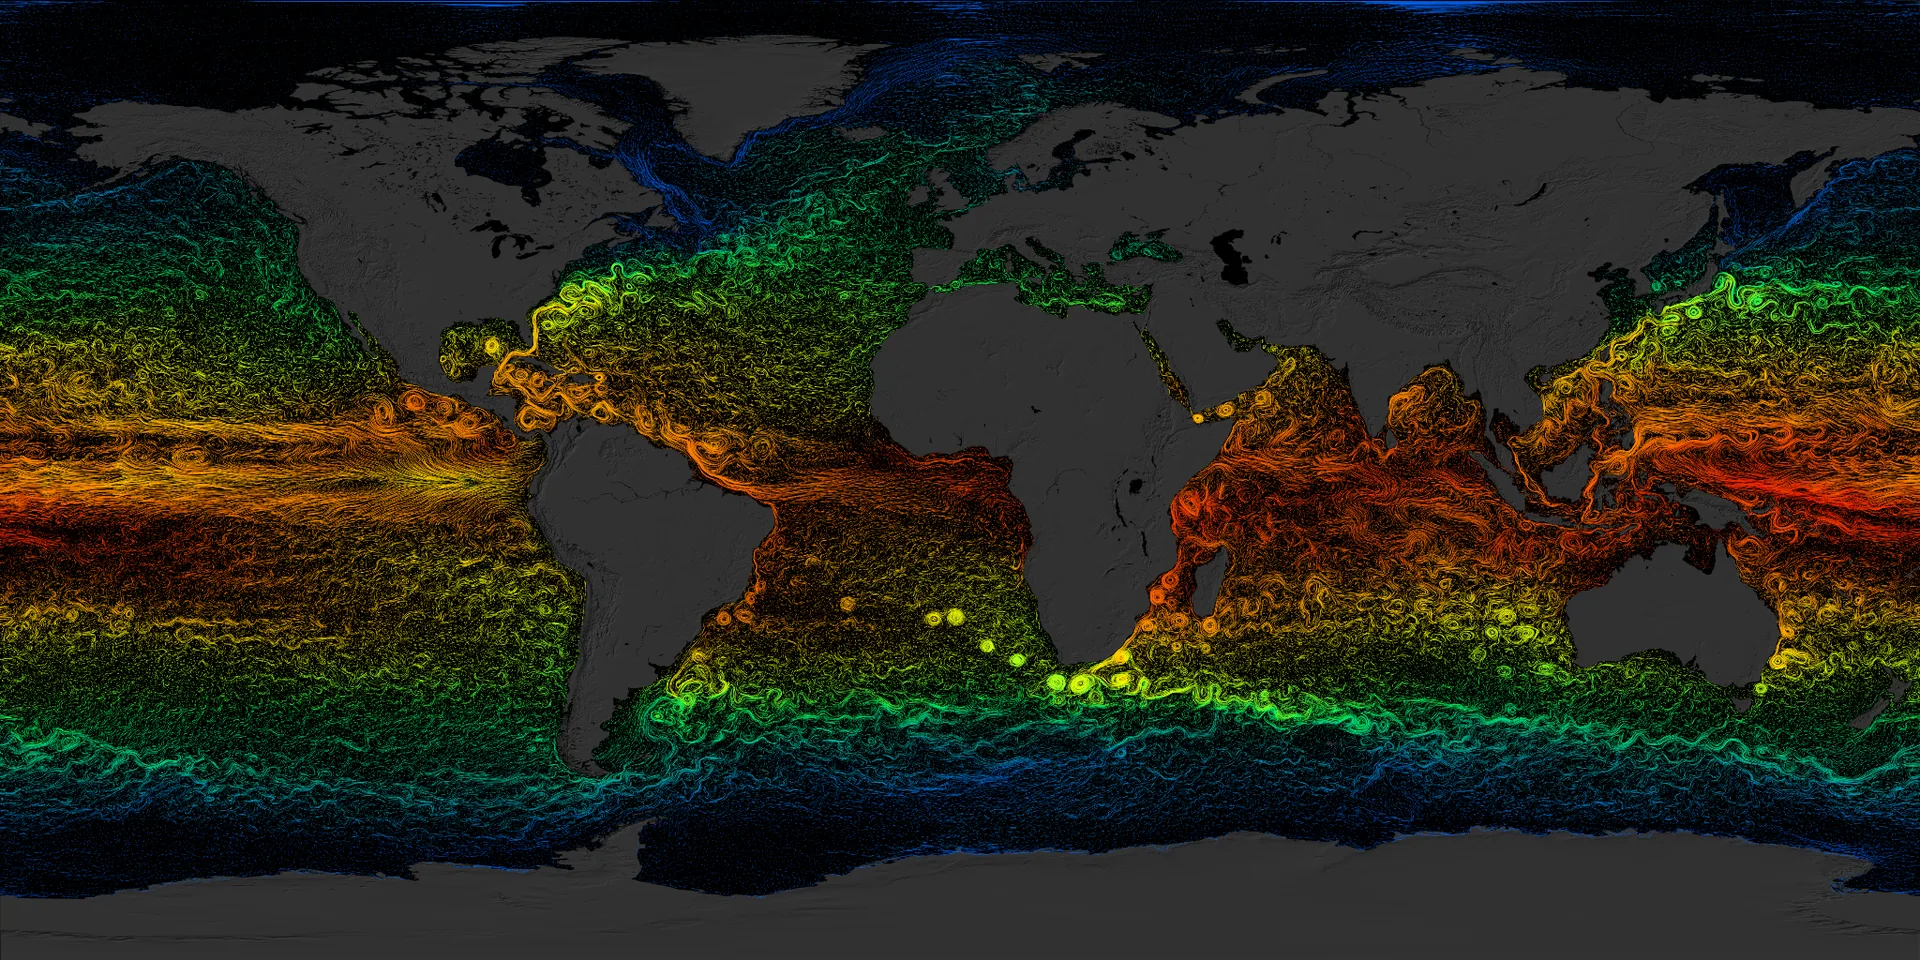 16 frames
Ocean surface currents drawn as strokes, colored by water temperature (ECCO2 model).
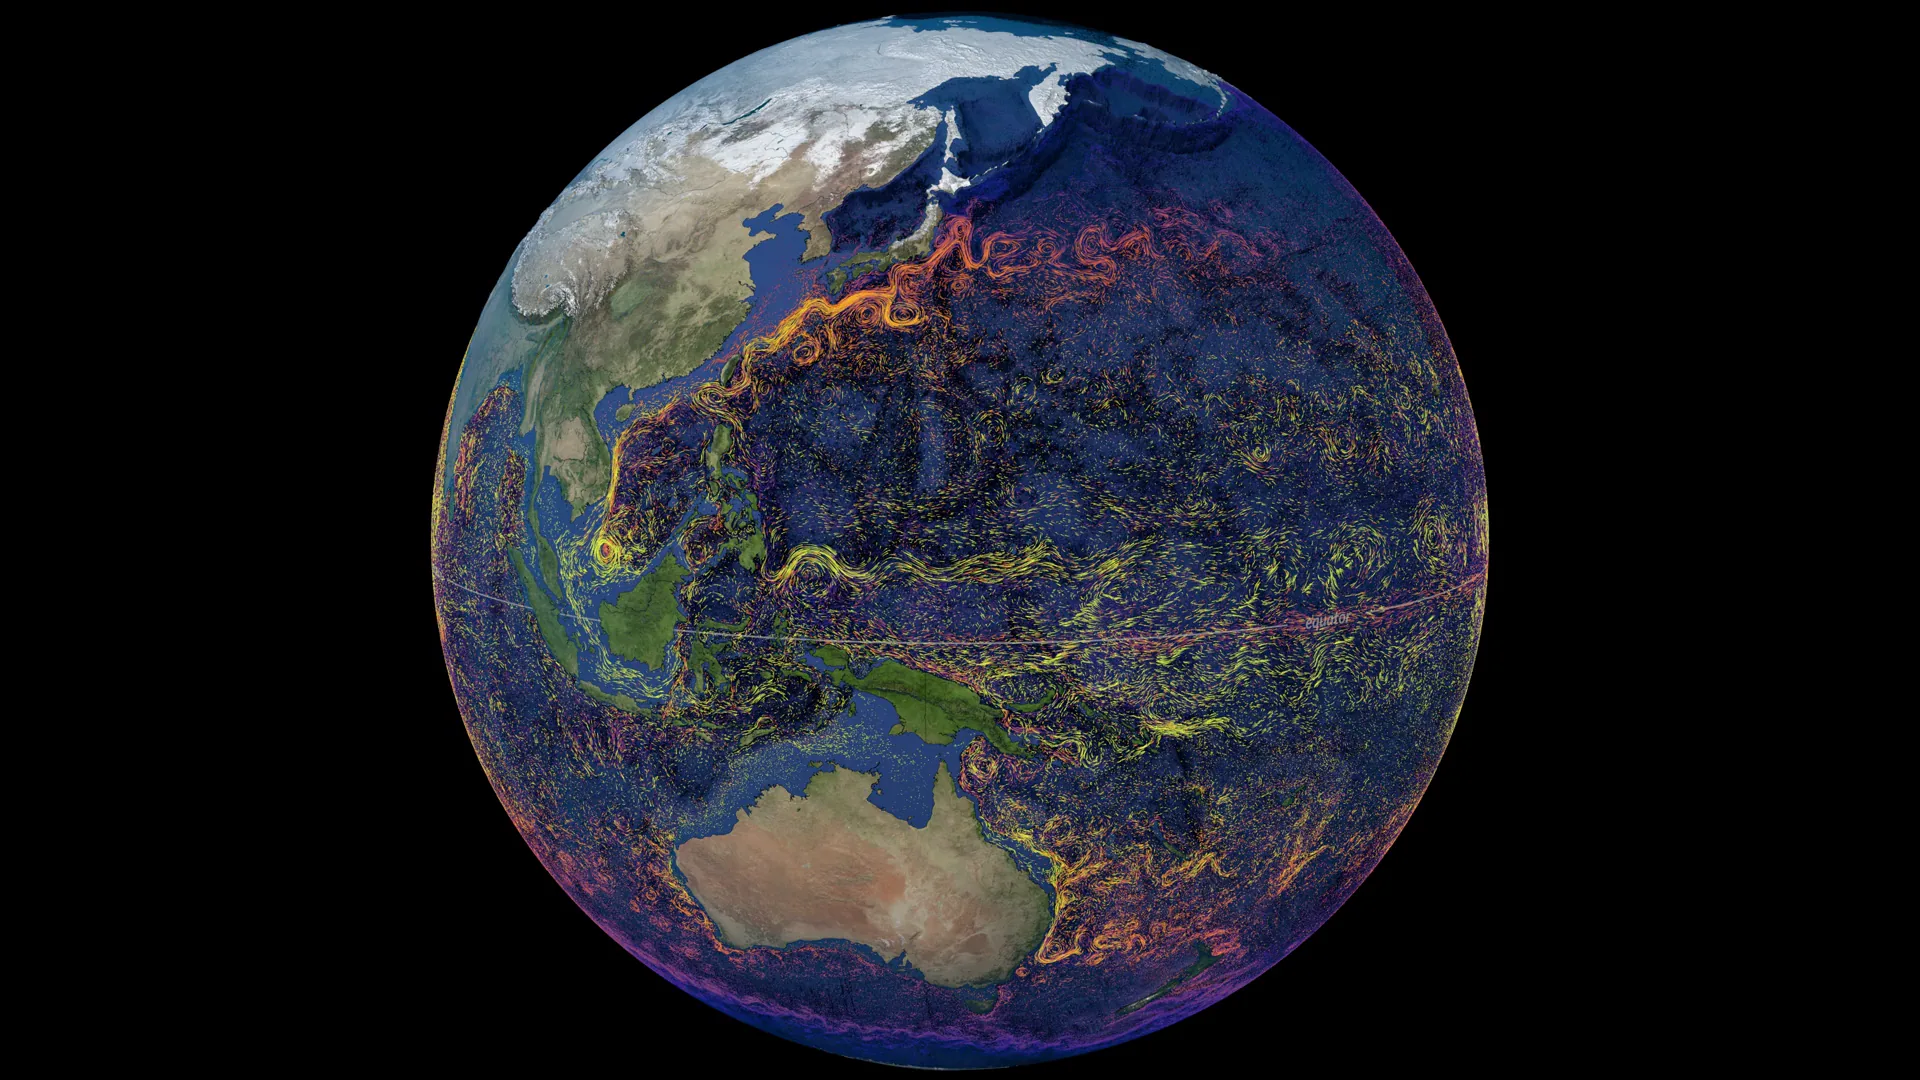 32 frames
A camera tour of the Kuroshio, Agulhas and Gulf Stream currents, colored by temperature.
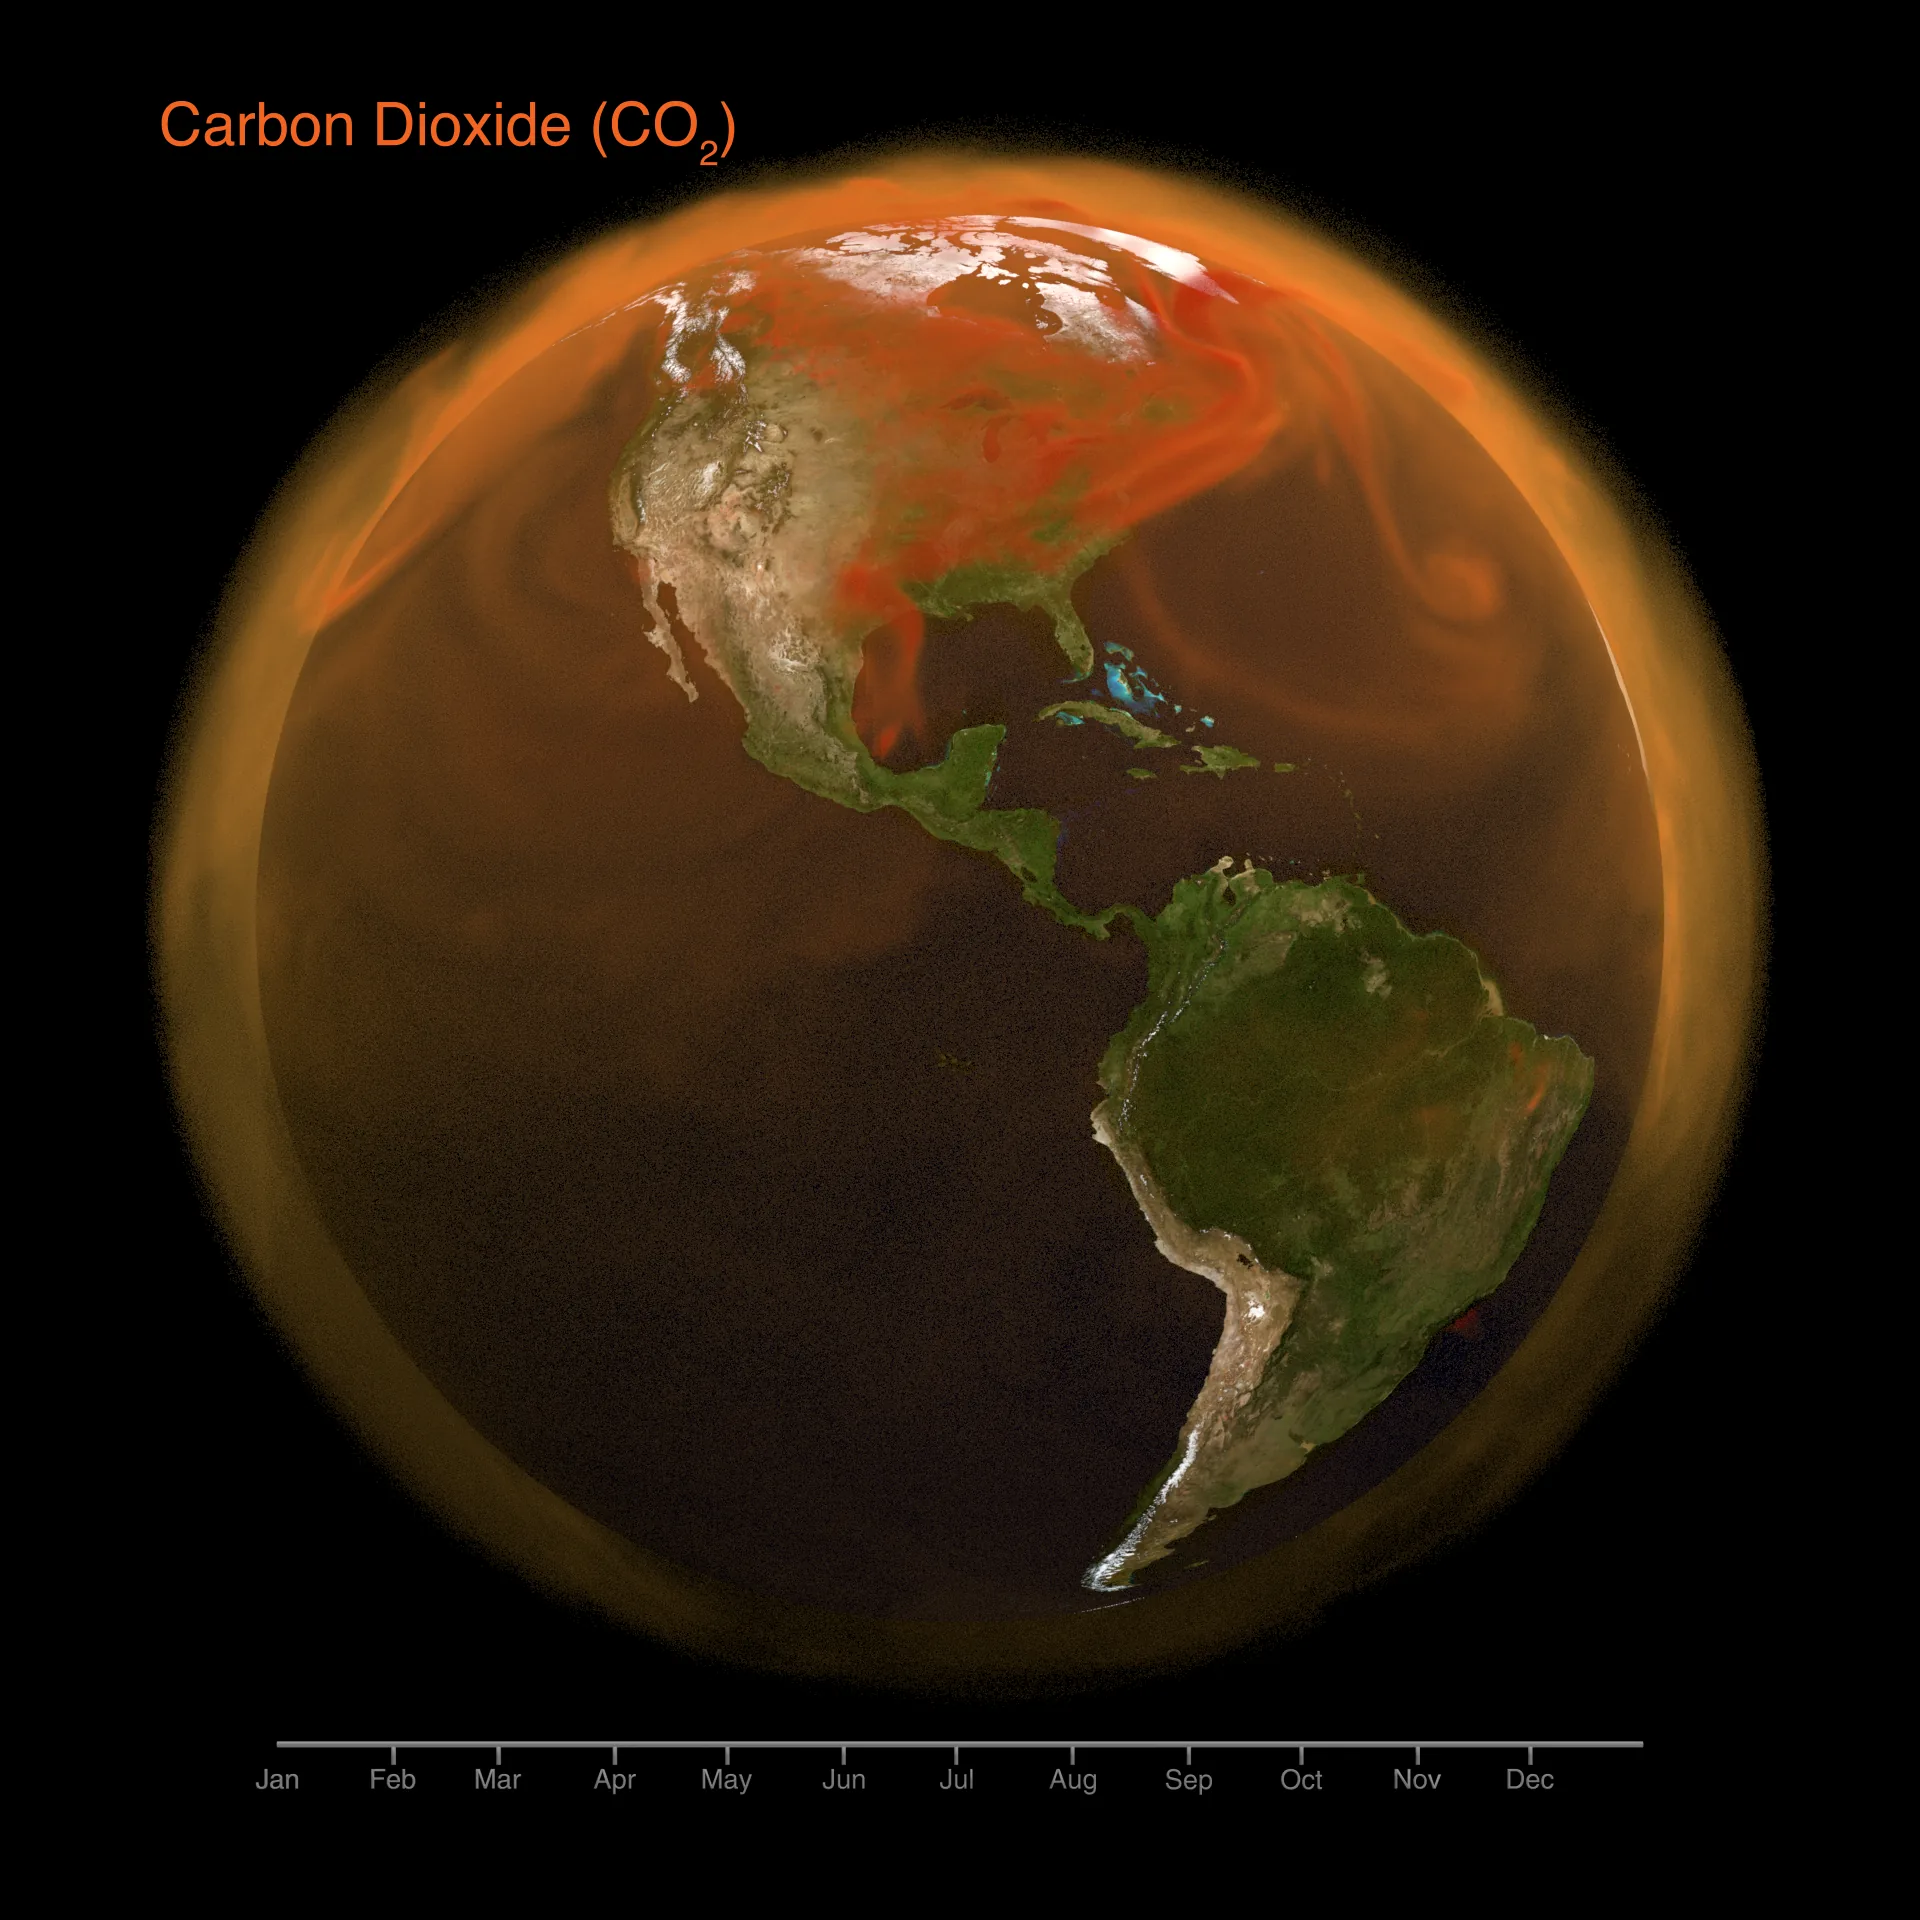 32 frames
A volumetric haze of the CO₂ added to the atmosphere during 2021.
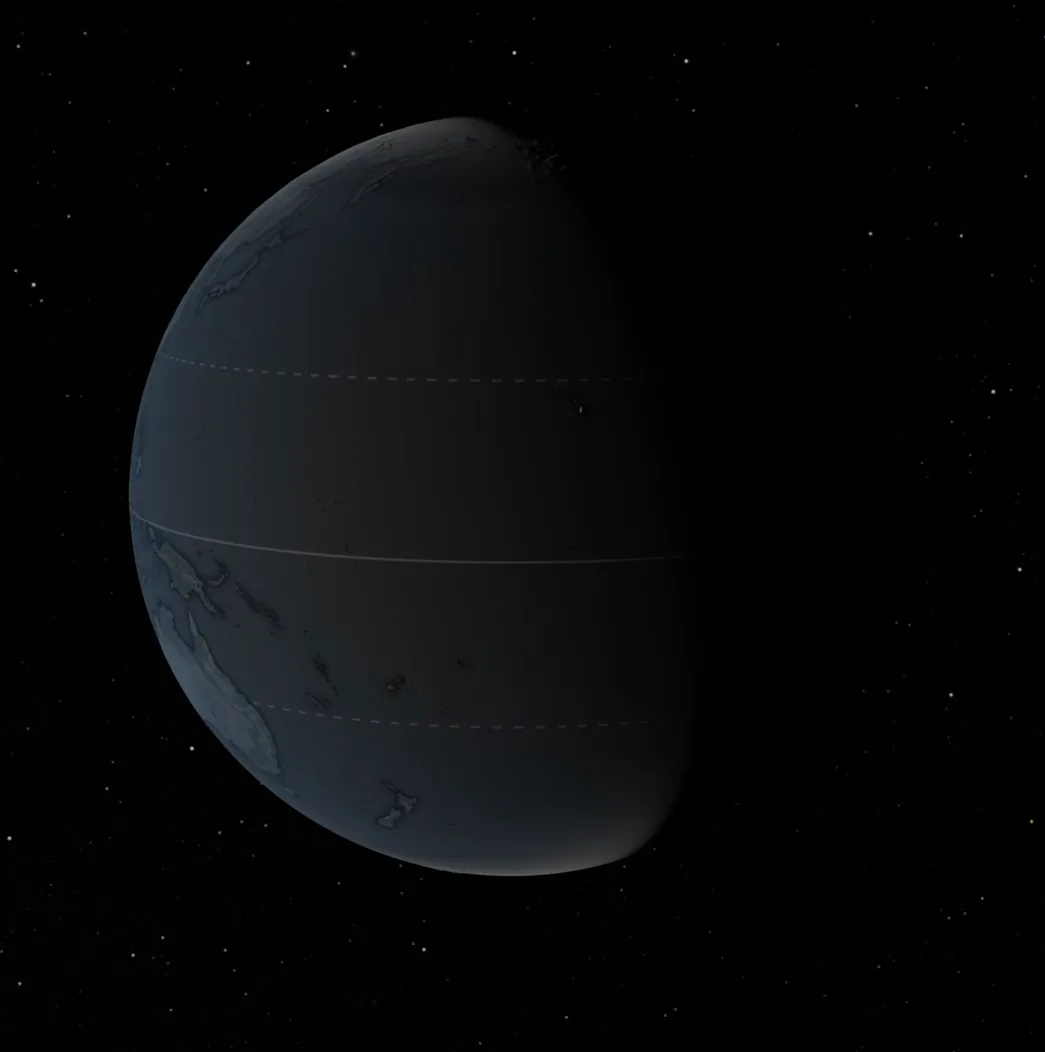 32 frames
Lightning detected by the LIS sensor on the International Space Station.
NASA GIBS · Earthdata
Global satellite products served by NASA’s Global Imagery Browse Services, each with an official color scale that tells us the real value of every pixel.
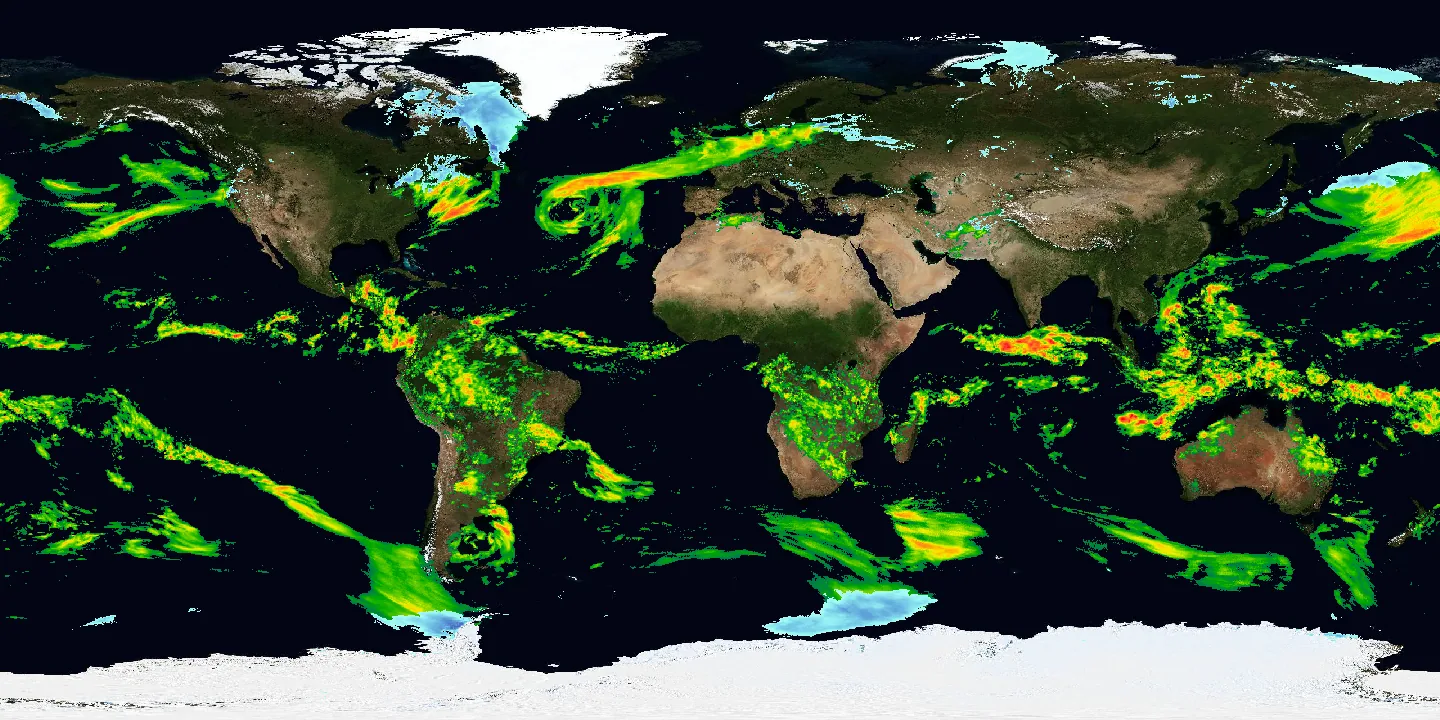 24 frames
Average daily rain rate around the world, from the GPM mission.
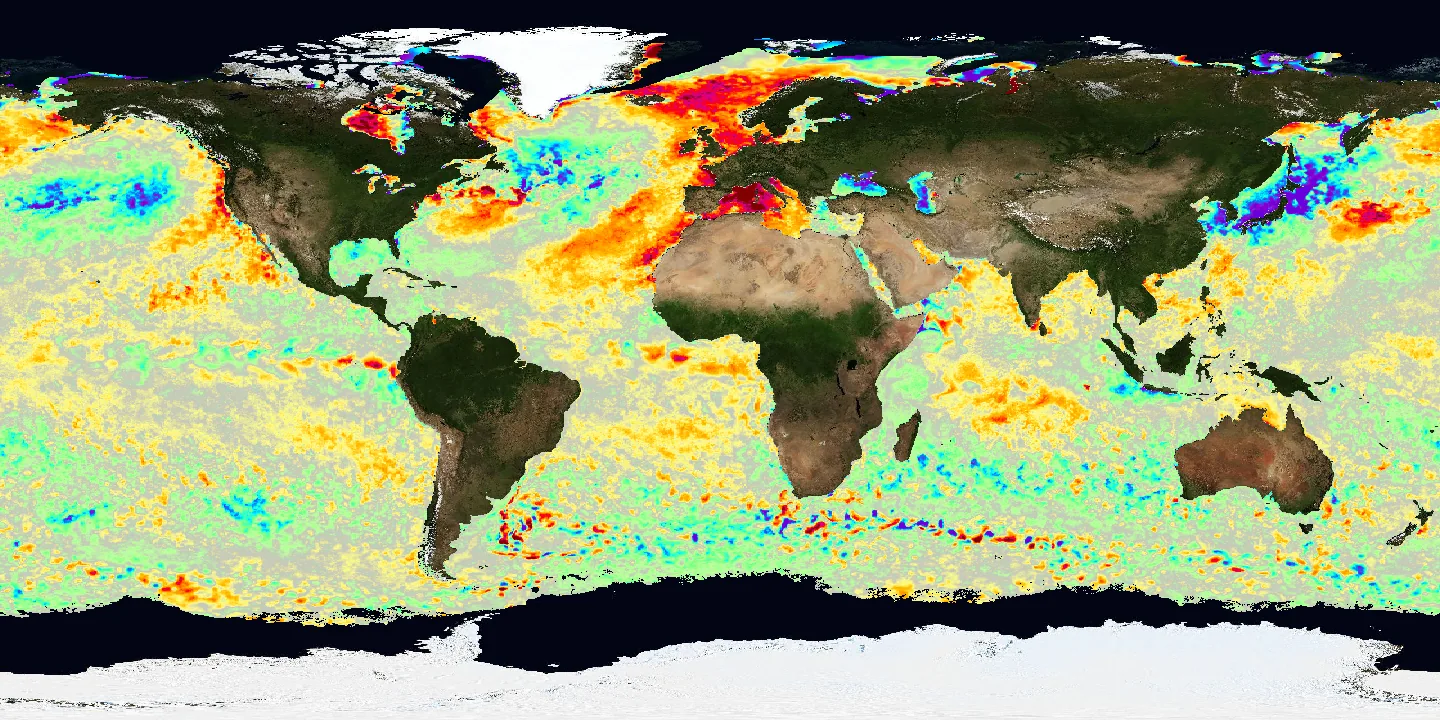 24 frames
How much warmer or colder the sea is than normal (GHRSST MUR).
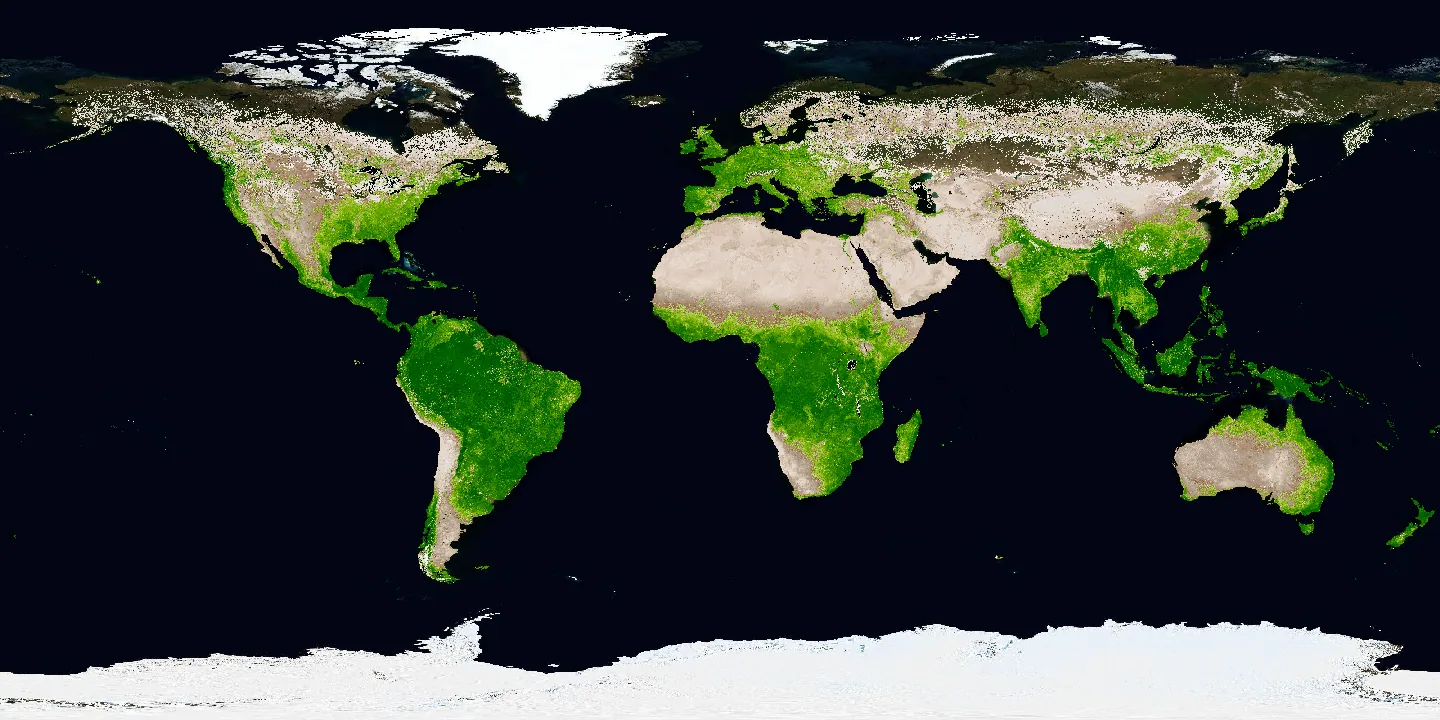 12 frames
How much green, active vegetation covers the land (MODIS Terra).
NASA Space Apps Challenge 2026 · Earth Information Center
The starting point: the visualizations and references the challenge shared from NASA’s Earth Information Center.
For the curious
The raw material behind each track: the exact frames and videos we downloaded, and the color bars and tables we used to turn colors into numbers.
Imagery and data courtesy of the NASA Scientific Visualization Studio (opens in a new tab) and NASA GIBS (opens in a new tab). Model fields (GEOS, ECCO2) are estimates, not direct observations. Earth Jukebox is a NASA Space Apps Challenge project and is not endorsed by NASA.
Mascot
Hi! I'm the Earth Jukebox mascot. Soon I'll tell you what you're listening to.